Building on the factor-based stock research of the Fama-French model, the smart beta alternative portfolio construction process aims to enhance returns, reduce volatility in different stages of the economic cycle, minimize risk, and maintain diversification. Instead of tracking market capitalization- or liquidity-weighted benchmarks that are solely focused on fluctuations in price, smart beta strategies track indices with weighting techniques that follow specific factors or screens such as size, value, quality, momentum, fundamentals, volatility, or dividends (and any combination of them). Often, this approach is viewed as a mixture of traditional active and passive strategies, where smart beta strives to overcome overweighting and underweighting issues of market-cap weighted index funds and the high cost and less transparent nature of active funds. The security selection process that is implemented in a smart beta strategy can have an impact on the inherent structure of the ETF, which can cause its operational expenses and performance to differ from a plain vanilla market cap-weighted ETF.
With regard to performance and expense benchmarking, it is important for directors to consider the impacts of combining or excluding smart beta ETFs with cap-weighted ETFs as these may deliver unexpected results. Due to their fairly recent development (arguments abound about “The First”, but a safe bet can be made that PowerShares Dynamic Market Portfolio (PWC), which launched in 2003, could wear the crown) long-term comparisons are difficult to find: roughly half of the current list of smart beta products tracked by Broadridge launched in the last five years. Furthermore, their distribution in the fund ecosystem is fairly concentrated with nearly 30% of them in Morningstar’s three large-cap categories and just 26 located in various bond categories.
Due to their alternative index tracking nature we expect smart beta ETFs to have expense ratios relatively lower than active funds yet higher than ETFs that track a well-known index, such as the S&P 500. However, due to the fact that smart beta ETFs are not always more expensive than cap-weighted ETFs and do not always provide outperformance it may be hard to find support for the argument to separate these when benchmarking. A director may ask, is there a discernable difference in value that a smart beta product is providing over a cap-weighted product in the same classification? And if there is a difference, is it due to the methodical weighting of different factors? For example, consider a smart beta ETF that outperformed its conventional benchmark over the last three years: was it because it weighted factors that were in favor or because it avoided heavily-weighted names that were not? Is this a reason to exclude it from comparison among cap-weighted strategies, or even other smart beta strategies focused on different factors? While easy answers are unlikely, our objective is to run the present slate of smart beta and conventional index funds through a few simple statistics and offer directors some evidence that may persuade them to accept or reject the mixing of smart beta and conventional products in peer groups.
However, as we pointed out earlier, there may be a limited number of smart beta (as well as non-smart beta) ETFs within each investment classification and an unequal number of products representing each side. A director may weigh the pros and cons of having a smart beta-only peer group of three funds versus a peer group of twelve funds with a mix of smart beta and non-smart beta. In this analysis we’ll consider summary statistics of smart beta and cap-weighted ETFs as a whole to gain an understanding of the difficulties in peer comparison.
Industry Trends
"As roughly 90% of all smart beta products are ETFs (we last counted 87 mutual funds that qualify as smart beta), we’ll confine our analysis to ETFs until the mutual funds side sees significantly more uptake."
Smart beta products have seen a surge of issuance recently, with approximately 39% of all products coming to market in the last three years. In fact, their issuance had such momentum that in 2016 industry analysts predicted they would attain over $1 trillion AUM by 2020. Although that sounds like a surprising number, given recent flows history (about $70 billion per year) and current AUM (around $700 billion) a 20% compound growth rate will lead them past $1 trillion in the next two years.
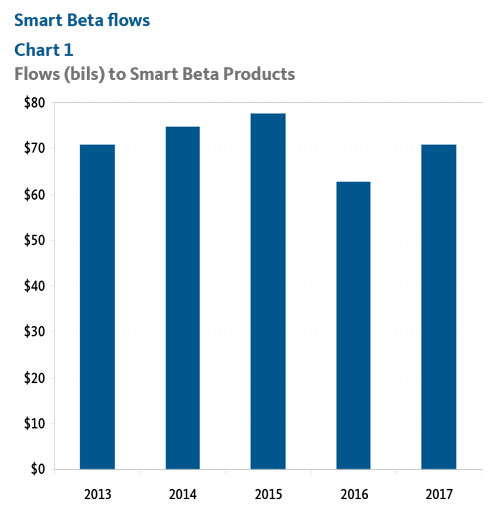
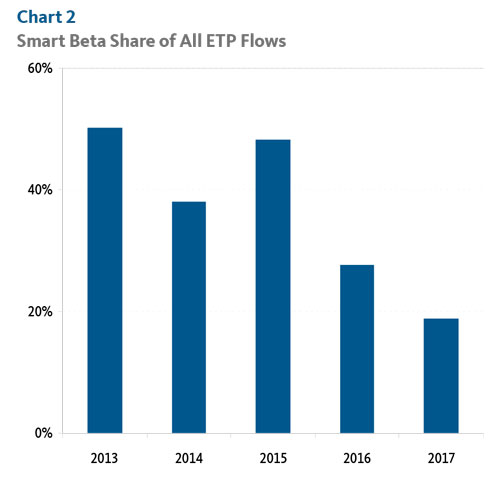
What might hold them back from that lofty goal? Failing to reach new investors. While $70 billion per year certainly adds up, the rest of the ETF industry is not ceding ground easily and smart beta products have been losing market share for new money for a few years. Where they once commanded almost half of ETF net flows, by 2017 they were down to 20%.
Going Behind The Data
What does Broadridge consider “smart beta”?
Broadridge categorizes smart beta as index-tracking investment products that do not benchmark traditional market cap-weighted indexes. The following types of indexes are excluded from our definition of smart beta: market cap-weighted sector, -country, -thematic, -geography, -volatility, and -quantitative. However, non-market-cap weighted sector and country indexes and style tilt strategies, (which screen for certain characteristics before taking market-cap into consideration) are included.
What does our analysis include?
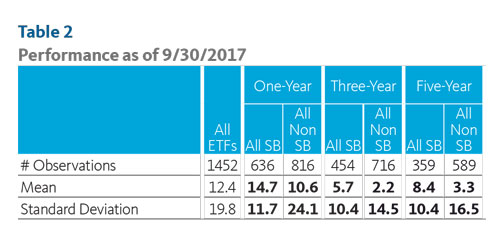
This analysis includes 642 smart beta ETFs and 819 non-smart beta ETFs, all of which are ETFs that could be included in a 15(c) peer comparison study. Of these, 636 smart beta ETFs and 816 cap-weighted ETFs have at least one-year of total return performance as of 9/30/17. For comparison purposes, the asset classes in this study include investment classifications with at least six smart beta and six non-smart beta ETFs.
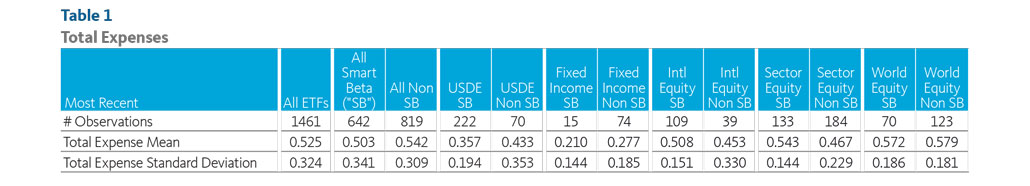
In Table 1 we can see how smart beta and cap-weighted strategies are dispersed across the five main asset class universes.
U.S. domestic equity (USDE) smart beta ETFs account for 35% of the smart beta market and outnumber their USDE cap-weighted counterparts by 152. International equity smart beta offerings make up 17% of the market and follow a similar smart beta to cap-weighted ratio to the USDE group, with 109 smart beta to 39 cap-weighted. On the other hand, the sector equity and world equity universes each have a smaller percentage of smart beta to cap-weighted strategies and make up 21% and 11% of the smart beta market, respectively. Please note that 93 smart beta funds are not reflected in the total asset class counts due to their placement in miscellaneous classifications and/or those with few or no peers.
This difference may be due to domestic smart beta strategies being less complicated to implement (due to differing accounting standards, market depth and listing, and other factors not associated with the U.S. market) than smart beta in world equity markets, as well as an acknowledgment of home bias investing (world equity product are always a more difficult sell).
In recent years smart beta has gained traction across the majority of investment strategy groups; however directors should note that smart beta strategies are mainly restricted to the equities universe. Fixed income, for example, has a small number of smart beta strategies largely due to liquidity constraints that can be incompatible with alternative weighting techniques. Other factors, such as market depth and optionality may also complicate the introduction of new smart beta products.
Analysis Overview
Total returns and expense ratios are key components to consider when benchmarking. In this analysis, we separate all smart beta ETFs from market-cap ETFs with the goal to decide whether or not it is appropriate to combine in peer group comparisons. We’ve gathered one-, three-, and five-year total return data, and most recent total expenses for all smart beta and cap-weighted ETFs. In order to gain an understanding about the viability of comparing smart beta ETFs and cap-weighted ETFs we produced summary statistics including means, and standard deviations, and tested for statistical significance using t-tests and f-tests. The t-test performs an analysis of two populations (smart-beta and non-smart beta ETFs) and tests if the difference in means is representative of a truly significant difference and is attributable to a cause, or if the difference is due to chance. The null hypothesis for the t-test is that there is no difference between the population means, and the alternative hypothesis states that there is a difference in the means. To determine if our data provides evidence in support of the claim that the difference is significant we take a look at the results of our t-test. In our analysis, a small p-value (≤ 0.05) indicates strong evidence against the null hypothesis. A large p-value (> 0.05) indicates weak evidence against the null hypothesis, where we fail to reject the null hypothesis. The f-test is used to test the hypothesis of the equality of two population variances. The f-test produces an f-statistic, which if larger than the f-critical value supports the claim that there is a significant difference in the standard deviations between the smart beta and non-smart beta ETFs. In this analysis statistically significant t-tests on mean total returns and expense ratios and statistically significant f-tests on standard deviations of returns and expense ratios are shown in boldface.
A significant difference is found
When analyzing all available smart beta and non-smart beta ETFs, there is a significant difference in mean total returns and standard deviations for one-, three-, and five-years. In each case, smart beta ETFs have higher means and less average variance. This suggests smart beta products experience higher total returns with less volatility. With regards to expenses, smart beta ETFs have lower mean total expense ratios but a larger expense variance, which could be due to the lack of scale among factor-based indexes. However, at the more refined asset class level when removing funds with miscellaneous classifications and/or those with few or no peers, we find that smart betas have lower expense variance.
USDE
In the USDE universe, smart beta ETFs are significantly less expensive and have less expense ratio variance as a whole. Smart betas have a mean total expense ratio of 0.357 and a standard deviation of 0.194, while cap-weighted ETFs have a mean of 0.433 and standard deviation of 0.353. Smart beta three-year returns are statistically higher and less volatile than cap-weighted returns.
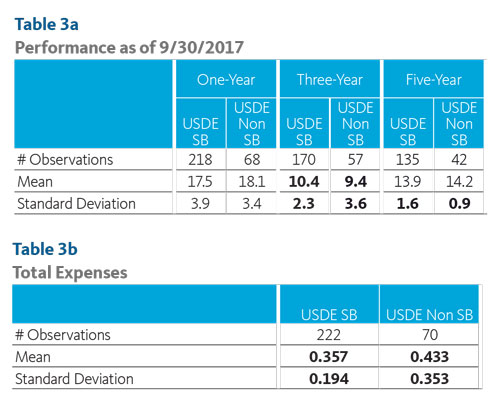
Taking a closer look into the individual Small Cap Core (SCCE) objective, we find the opposite to be true for three-year returns. Smart betas have lower returns and a higher volatility, yet we should note that this measure of significance is based off a small sample size of ETFs (15 smart beta and 11 cap-weighted). Additionally, it should be noted that Large-Cap Core (LCCE) and Mid-Cap Core (MCCE) have no statistical difference among their three-year samples of total returns.
Sector Equity
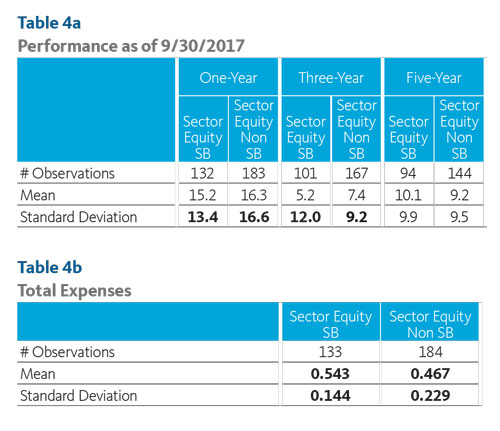
Sector equity smart betas have less volatility in their one-year returns, but higher volatility in their three-year returns, while their total return means do not have statistical differences. As for most recent expenses, sector equity smart betas have a statistically significant different mean expense ratio of 0.543 compared to its cap-weighted counterpart mean expense ratio of 0.467. However, the smart betas have lower expense ratio variance.
World Equity
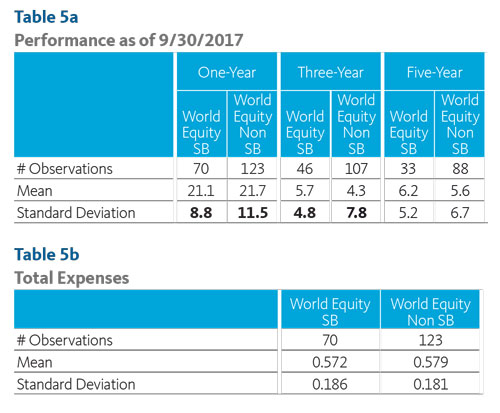
Similarly to sector equity, world equity smart betas and non-smart betas do not have significantly different total return means at the one-, three-, and five-year mark, however smart betas have less volatility at one-, and three-years compared to cap-weighted ETFs.
Emerging markets
Diving deeper, Emerging Markets (EM) ETFs emulate the broader world equity group for one- and three-year total return means and volatility in the sense that smart betas are less volatile than cap-weighted ETFs; however there is no significant difference in mean returns. Most recent expense ratios also prove to be statistically similar. There are enough smart beta and non-smart beta ETFs in the EM objective (28 and 33 respectively) to state that over one- and three-years smart beta ETFs have not provided significantly higher returns, and have not charged higher expense ratios for their factor-based strategies. It is difficult to claim that smart beta ETFs should be ruled out of peer discussion from standard cap-weighted ETFs within the emerging market universe.
Conclusions
Classification statistics
In the USDE objective, smart betas are less expensive and have less variant expense ratios as a whole. Smart beta three-year returns are statistically higher and less volatile than the cap-weighted strategies returns.
Sector and world equity breakdown:
There is not enough data to capture any meaningful differences between smart beta and non-smart beta total return means at the classification level. In other words, smart beta ETF performance does not show any signs of added value over standard cap-weighted ETFs in the sector equity and world equity asset classes.
Vulnerabilities of comparing smart beta
To further convolute this debate, there is a very limited number of available smart beta and non-smart beta ETFs within each investment classification and an unequal number of products representing each side.
Ultimately, small sampling size, overweighting of pricing philosophies and a lack of an equal proportion of smart beta and non-smart beta ETFs within classifications can make it difficult to label certainties about the differences between these two groups.
Cyclical nature of factor-based investing:
There may not be enough long-term data to support claims on how certain smart beta strategies perform. For example, a low volatility factor-based ETF may be able to outperform in times of fear and uncertainty, such as in 2008-2009, but the same ETF will most likely underperform in an improving economy with bullish conditions due to the fund’s strategy to hold stocks with the lowest expected price movement. On the other hand, a momentum strategy will aim to outperform the market in any economic cycle as they reallocate assets into recent strong performers. The cyclical nature of smart beta strategies and the importance of having a long-term perspective when comparing factor-based ETFs make it difficult to determine which smart beta and/or cap-weighted ETFs should or should not be benchmarked against each other.
Takeaways
- Within asset classes, smart beta products have higher returns, less volatility, lower mean total expenses, and a lower expense variance than cap-weighted strategies. However, at the classification level these statistics tend to vary, which is most likely attributed to inadequate sample size.
- Despite the lack of convincing data at the classification level, Broadridge suggests separate peer groups for smart beta and cap-weighted ETFs.
- However, in some classifications the population of funds for comparison is small enough that combining smart beta and market-cap funds will be required to create a properly sized peer group.
- Combining smart beta funds across asset classes (e.g., equity and bonds) is not recommended. Combining products across classifications will follow Broadridge’s standards as they apply to specialized funds.
- Benchmarking performance between smart beta and capweighted ETFs is questionable as the portfolio construction processes are inherently different.
- Due to limited samples within classifications single-factor and multi-factor strategy differences were not studied. As more products become available single-factor and multi-factor trends could be a topic for further analysis.
Resources
http://etfdb.com/fixed-income-etfs/why-smart-beta-not-proliferated-fixed-income-space/