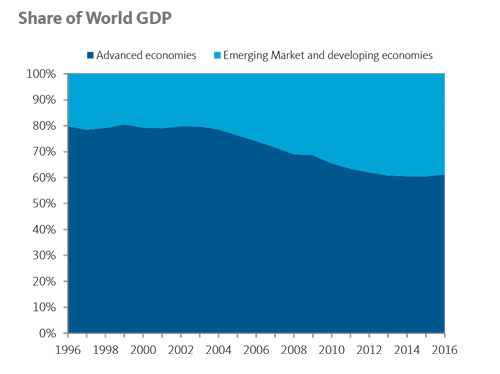
In recent years, emerging market debt has garnered the attention of investors seeking a higher yielding alternative to developed market bonds. This is due in part to the greater capacity for economic growth in relation to developed countries and improved economic climates in many countries in Asia, Latin America, Eastern Europe, Africa, and the Middle East. According to data sourced from the IMF, since 2003 their share of global gross domestic product (GDP) has roughly doubled and now accounts for about 40% of the total and is forecasted to increase through 2022. The growing sophistication of fiscal and monetary policies has increased foreign investors’ confidence in debt issuances, creating a ‘virtuous cycle’ where improved fiscal and monetary policy begets better credit ratings, which draws investment, which in turn begets higher productivity and earnings, and leads to yet more investment and faster growth.
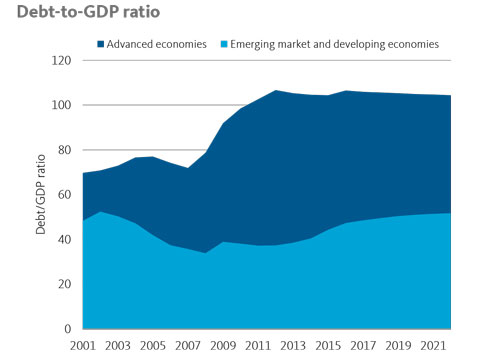
Meanwhile, since 2001 advanced economies have increased their debt-to-GDP ratio and have kept it over 100% for most of the current decade—and are expected to stay above that level for the foreseeable future. In contrast, the debt ratio of emerging market economies has remained fairly steady and at a much lower level. This lower percentage of debt-to-GDP suggests that emerging market economies have been developing stronger economic policy and fiscal responsibility.
The growing sophistication of fiscal and monetary policies has increased foreign investors’ confidence in debt issuances, creating a ‘virtuous cycle’
Local currency-denominated debt (of sufficient duration) wasn’t widely available to U.S. investors until the turn of the 21st century. To that point, only “hard currency” bonds (denominated in U.S. dollars, or euros, or yen, typically) had enough liquidity to appeal to mutual fund managers. Sometimes called “Brady bonds,” after the U.S. Treasury secretary who promoted them as a means to help beleaguered Latin American economies in the early-1980’s, these bonds had an obvious flaw for issuers: should their currency fall in value relative to the U.S. dollar (or whichever hard currency they were issued in), the interest expense grew less and less affordable. During the 1990’s, investors learned hard lessons about the credit worthiness of emerging markets during currency crises in Mexico and Thailand that led to annual losses of 20% or more twice in five years. Local currency debt has been the largest share of emerging market debt issuance for several years, as measured by the size of the JP Morgan indexes.
Directors should also be mindful of credit downgrades and their effect on portfolio risk. For instance, China’s government debt was downgraded in May 2017 by Moody’s after 30 years of stable ratings; Brazil and South Africa have also seen their credit ratings downgraded in the past year. In fact, roughly 51% of the JP Morgan EMBI Global Diversified Index (a hard currency government bond index) was rated high yield or “junk” in mid- 2017; it was only 34% at the end of 2013.
Emerging Market Debt and Indices
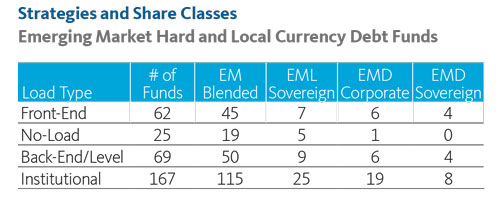
There are a total of 323 share classes in the emerging market hard currency debt (EMD) and emerging market local currency debt (EML) objectives. Of these, 52% are institutional load funds, 19% are front-end load, 21% back-end or level-load, and 8% are no-load funds. When analyzing emerging market debt performance and volatility trends, some analysis must be placed on portfolio holdings. This study categorizes funds with at least 75% government debt holdings as either EML sovereign or EMD sovereign, and categorizes funds with at least 75% corporate debt holdings as EMD corporate. Funds in the EM Blended group have a mix of corporate and sovereign holdings with no more than 75% of assets held in either corporate or sovereign issuances. There’s a significant amount of portfolios investing in local and hard currency sovereign and corporate debt, however it is important to note that there are no portfolios in this study that invest 75% or more of assets in emerging market local currency corporate debt. Blended funds with local currency debt commonly have a high percentage of assets in government issuances. In terms of strategy popularity, we find there are 56 with blended currency and sector strategies, 23 that are local currency sovereign, 10 that are hard currency sovereign, and 16 that are hard currency corporate.
In this analysis, performance and standard deviation calculations are based on 89 portfolios in the EMD and EML objectives, excluding outliers. The universe of funds was narrowed down to only include the primary or largest share class in order to reduce the chance of overweighting.
Indices
In an analysis of more than 100 emerging market debt mutual funds, the clear leader among benchmarking firms is JP Morgan, with 91 out of 105 funds (roughly 87%, including blended benchmarks) citing a JP Morgan emerging market index as their performance benchmark. JPM’s oldest and most popular benchmark, the JP Morgan Emerging Market Bond Index (EMBI, now a suite of indices), was followed by the Government Bond Index-Emerging Markets (GBI-EM) series and the Corporate Emerging Markets Bond Index (CEMBI) for local currency government debt and hard currency corporate debt benchmarks, respectively (interestingly, the emerging market corporate debt sector is nearly the size of the U.S. high yield debt market). Directors should note that variations on each of these exist for expressly different purposes. For example, GBI-EM Broad is a complete market index and includes all eligible countries regardless of capital and regulatory controls. Mutual fund managers instead reference the GBI-EM Global (for local currency government bond funds), which is an investable benchmark of securities that are accessible by most international investors. It resembles the GBI-EM Broad but excludes bonds from China and India.
Traditionally, emerging market debt managers allocated as market liquidity would allow, which meant their portfolios were weighted significantly toward sovereign (government) debt and generally denominated in hard currencies. However, in the NBER working paper Emerging Local Currency Bond Markets, the authors note that the period since 2000 has seen tremendous growth in local currency bond issuance, partly from development of local institutions (such as asset managers, banks, and insurers) and also from global investors.
It’s also important to note that categories from fund trackers such as Morningstar and Lipper are less specialized than index providers (each has just two: EM local currency and hard currency). Directors may need to consider that selecting peers based on a common performance benchmark may lead to a more robust analysis than simply going by their fund’s category. Much of the analysis that follows is a departure from the two category system and instead looks ahead to an idealized four categories for emerging markets debt.
Performance and Expenses
Performance
Investing in emerging markets debt runs the risk of political and economic instability, credit quality, as well as currency volatility of developing countries. This volatility is tied to exchange rate fluctuations and currency devaluations. The rate of the dollar in relation to the local currency can affect yield. EML funds, as classified by Lipper, realized a mean rolling annual yield of 5.70% for the year ended 12/31/2016 and EMD funds realized a mean rolling annual yield of 4.58% for the year ended 12/31/2016.
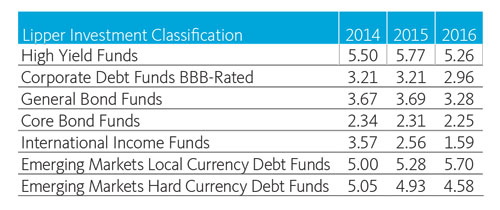
As represented in the table above, yields are attractive for emerging markets debt relative to other types of income and debt objectives. Emerging markets local currency and hard currency debt funds have greater rolling annual 12 month yields than BBB-rated, general bond, core bond, and international income funds for the past six years. Directors should note that although high yield funds have produced higher relative current yield, there is still a larger chance of default when investing in high yield lower-grade debt issues.
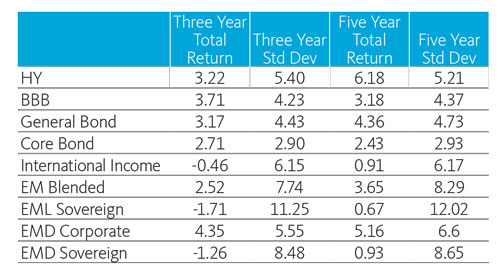
The table above breaks down EM debt into the aforementioned categories in order to reveal variances in returns and standard deviations across these debt types.
Emerging market debt is known for being a volatile investment, with three-year and five-year standard deviations ranging higher than the majority of domestic debt. International income (INI) funds are on par with emerging hard currency corporate debt in terms of volatility, however INI funds are less volatile than EML sovereign and EMD sovereign debt over three and five years .
Blended portfolio returns may differ vastly as assets are moved in and out of corporate and sovereign debt denominated in hard and local currencies year over year. Within the universe of blended emerging market debt funds, portfolio reallocations can lead to potentially large performance differences and make ranking and benchmarking difficult for a highly focused fund manager. In the above performance and standard deviation table, three- and five-year total return for the EMD corporate and EMD sovereign groups varies by a significant degree. If an EMD corporate fund is peered against other EMD sovereign funds volatility and returns will inherently be differerent due to the nature of these funds investments, however it may not be readily obvious that these funds in the same objective are investing in diverse debt issuances. Risk measures on the different types of debt in EML and EMD objectives can help boards to consider how asset selection and strategy can have an impact on relative performance rankings across otherwise similar funds. A more confined and strategy specific peer performance group (selecting from only EMD corporate funds) could provide more accurate relative rankings than a larger peer group (selecting from all available EMD funds) that emphasizes sample size.
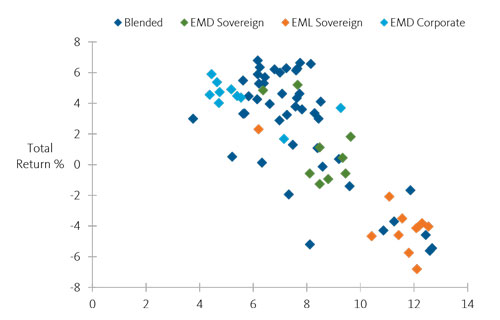
Due to currency fluctuations, U.S. dollar-denominated emerging market bonds generally experience less volatility than local currency bonds. The performance of bonds issued in U.S. dollar terms experience no additional impact from exchange rate risk. This is illustrated by the EMD Corporate and EMD Sovereign portfolios in the total return v. volatility chart above. Over three years, hard currency debt funds have experienced less volatility and higher total return when compared to local currency funds. However, it must be noted that investments in local currency bonds can benefit from stronger economic growth in emerging market nations and diversification outside of the U.S. dollar. Well performing bonds can serve as a catalyst for further growth, and as emerging market economies are forecasted to continue developing strong economic environments, local currency debt could turn into a valuable opportunity.
In the chart above, blended funds represent portfolios that spread their assets across corporate and sovereign debt denominated in local and hard currencies. These fund’s total return and volatility vary greatly due to their focus on multiple sectors of the market. Blended funds can benefit from greater diversification across currencies, countries, and debt types. When aiming to avoid risk, a blended portfolio could offer downside protection if the majority of holdings are in hard currency corporate debt, while a portfolio with a higher risk profile may benefit from local currency debt in a thriving emerging market economy.
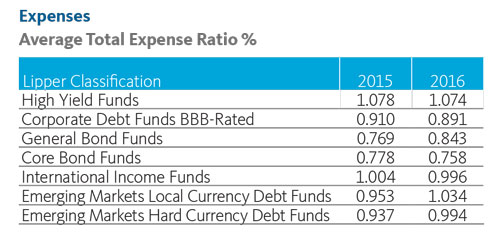
Emerging market debt funds can be expensive to operate because of the arduous selection and maintenance of potentially risky debt securities in foreign countries, higher trading costs, and foreign taxes. In the last two years, average total expense ratios have sat slightly below 1.0% for hard currency debt funds and around 1.0% for local currency debt funds. International income funds and high yield funds have reported similar expenses between 0.996% and 1.078%. Domestic debt funds are generally cheaper to operate as total expense ratios range from 0.758% to 0.910% for the past two years. Ultimately, investing in emerging market debt can provide growth and diversification at the cost of a slightly higher price tag.
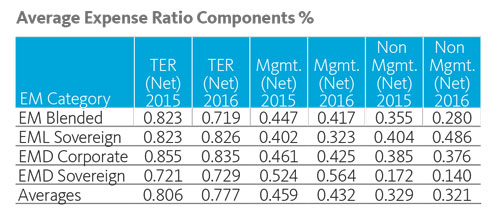
In the table above, primary share class expenses are broken down into four emerging market debt categories. In 2015 and 2016 hard currency sovereign funds were less expensive than their local currency counterparts. For the same years hard currency corporate funds had the highest average expenses; total expense ratios of Blended funds increased by 13% from 2015 to 2016. This could be due to fund managers reallocating from sovereign to corporate debt, which can make it difficult to benchmark fund expenses without considering the debt and currency of each fund year over year.
Directors should note that varable expenses within the local currency and hard currency objectives could affect benchmark rankings. This could also have a substantial impact on the perception a fund manager has on how their fund is priced in relation to other funds in the emerging market debt universe.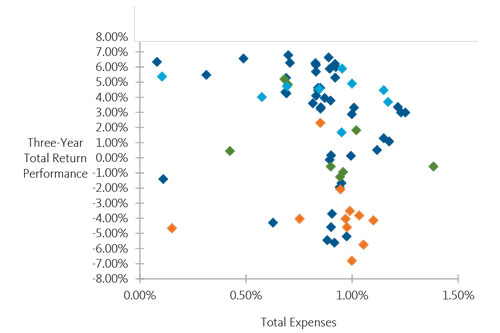
That said, expenses differ broadly from fund to fund. Because hard currency debt funds are generally less volatile and less expensive than local currency funds, it is expected that hard currency funds would fall somewhere in the upper left quadrant of the chart above. Volatile local currency debt funds that invest in bonds with higher default rates may show up in the bottom right quadrant, particularly if the local currency is depreciating relative to the hard currency. Blended funds are seen across the spectrum in regards to performance and expenses, making it difficult to benchmark funds without examining holdings.
Conclusion
Takeaways for Directors
- Although it has leveled off in recent years, emerging market economies are already 40% of global GDP and exposure to them (through both stock and bond fund selection) is a prudent source of diversification for all but the most conservative retail investors—and particularly so for those still in the wealth accumulation phase.
- EM debt denominated in local currency is now the largest portion of EM debt, though much of it is government (sovereign) issued. Corporate debt is still usually issued in hard currency.
- While the choice of which index peers benchmark themselves to is unlikely to matter for expense comparison purposes, it most certainly will impact how managers construct internal performance peers. Given the nearly complete dominance of the JP Morgan suite of indexes, managers that choose another provider may employ strategies not followed by many others.
- Country and corporate credit ratings for bonds denominated in hard currencies are often rated lower than that of their local currency issues, as currency mismatches present an additional source of risk. Directors may consider that currency fluctuations could change country and corporate credit ratings, which can impact expenses and performance of peer funds that are denominated in the same currency, have the same objective, yet hold different types of emerging market debt.
- EM debt funds are typically more expensive than domestic debt funds. In the past three years, performance and expense have shown a discernible relationship across the four EM debt strategies, which suggests currency and sector management plays an important role for these assets.
- The specialization of peer groups almost certainly comes at a cost in terms of the number of good peers. With other mitigating factors such as asset comparability and distribution channel playing equally important roles in peer group selection, directors need to be mindful of trading sampling size for strategy specificity.
- Product creation has also slowed, with just three local currency and four hard currency mutual funds rolled out since the end of 2014. Fund sponsors are likely to wait for stronger inflows to these strategies before launching any new ideas. This will clearly impact the ability of boundary-pushing funds to find similar peers.
Note: Performance, Expense, and Asset data sourced from Lipper Background GDP data sourced from the IMF
Sources
- “World Economic Outlook (April 2017).” IMF DataMapper, International Monetary Fund, Apr. 2017, www.imf.org/ external/datamapper/datasets/WEO/.
- Sokol, William. “A Case for Emerging Markets Bonds- VanEck.” VanEck - A Global Investment Money Manager Based in New York City, VanEck, 23 Nov. 2016, www.vaneck.com/blogs/emerging-markets-bonds/ case-for-emb-part-1/.
- Burger, John D., et al. “Emerging Local Currency Bond Markets.” National Bureau of Economic Research working paper, August 2010
- Phillips, Cristopher B., et al. “Emerging Market Bonds—Beyond the Headlines.” Vanguard Group, May 2013