With the advent of Consumer Duty in the U.K., the importance of Assessment of Value (AoV) and its support of the Price and Value outcome continues to grow. Although focused originally on open-ended investment companies and unit trusts (OEICs), many asset managers both within the U.K. and outside have expanded AoV review to additional products, such as pensions and investment trusts, as well as cross-border Undertakings for the Collective Investment in Transferable Securities (UCITS) to comply with the Price and Value outcome.1
Broadridge’s aim with our AoV series is to provide a starting point for understanding, implementing, and improving the value review process. We currently rely heavily on our initial experience in working with U.S. asset managers on 15(c) reporting, as well as the experience we’ve gained working with U.K. asset managers on their first AoV cycles. Each asset manager will need to implement Assessment of Value and the Price and Value outcome based on their unique definition and evaluation of value, as well as the unique benefits provided by different product types. The evaluation of value for a diversified equity open-ended investment company will not be identical to the steps used to evaluate an investment trust.
Value - 1 The regard that something is held to deserve; the importance, worth, or usefulness of something. 1.1. The material or monetary worth of something. 1.2 The worth of something compared to the price paid or asked for it. – Oxford Dictionary
What is Value?
With the Financial Conduct Authority’s (FCA) rules requiring management companies (and in the case of OEICs independent non-executive directors (i-Neds), to review and analyze products to ensure a fund provides value), the inevitable question that arises is “what is value?” Over time, the industry may come to a similar set of metrics to determine if value exists. As we begin our path towards complying with the AoV and Consumer Duty, however, it is worth investigating factors that may help with the assessment process. We should note that parity in how funds assess value is not necessarily the right answer. Each management company, and even each fund within a management company, have unique attributes that should be used to determine and measure fund value.
The responsibility for measuring value falls on both executive directors and i-Neds. Intrinsically, these two groups will enter the discussion from different angles providing meaningful dialogue and discourse related to each fund. As part of this process both groups will need to have a very detailed and holistic understanding of the funds they oversee. This understanding should include knowledge of what a fund’s investment goal is, the strategy the fund will use to reach this goal (both highlighted in other portions of the FCA’s Market Study), provide an understanding of how the fund is positioned and marketed to investors, and deliver a general understanding of the market for each fund. Although there are material differences between the requirements for the U.K. AoV and the U.S. 15(c) requirement, there are many similarities that can be used as a guidepost to help management companies and i-Neds determine how to evaluate the value of each fund and create a realistic process to adhere to the rule.
How do we Measure Value?
Although the process for measuring and evaluating the value will vary by management company, there are some factors that will be consistent — essentially forming best practices. Any evaluation of a fund will include quantitative analysis and qualitative analysis. The weighting of these measures will change by management company, likely even by fund within each management company, and over time as each fund company evolves. The consistent quantitative factors used to evaluate value include expense comparisons, total return comparisons, and risk measure analysis. On the qualitative side, management companies and i-Neds will use data gathered from the quantitative analysis to establish questions and answers that truly help understand each fund.
To demonstrate how these metrics can be used to evaluate a fund, Broadridge typically recommends a tiered approach, looking at results for all funds, funds by asset class, and finally individual funds. This allows an understanding of potential consistent themes, or areas of concern for the board to review. For example, we typically review the relative rankings of all funds run by a management company, then all funds within a specific asset class, and finally each fund individually.
Assessment of Value Case Studies: Looking Beyond Rankings
Many issues will need to be reviewed to determine “value.” If one only looks at the relative rankings for a fund the conclusion around value may differ than the conclusion drawn when considering additional factors. The four examples presented here, based on actual IA primary share classes in the U.K. All Companies IA sector, are but a few of the many scenarios directors will encounter in their assessments of value.
Assets versus Expenses
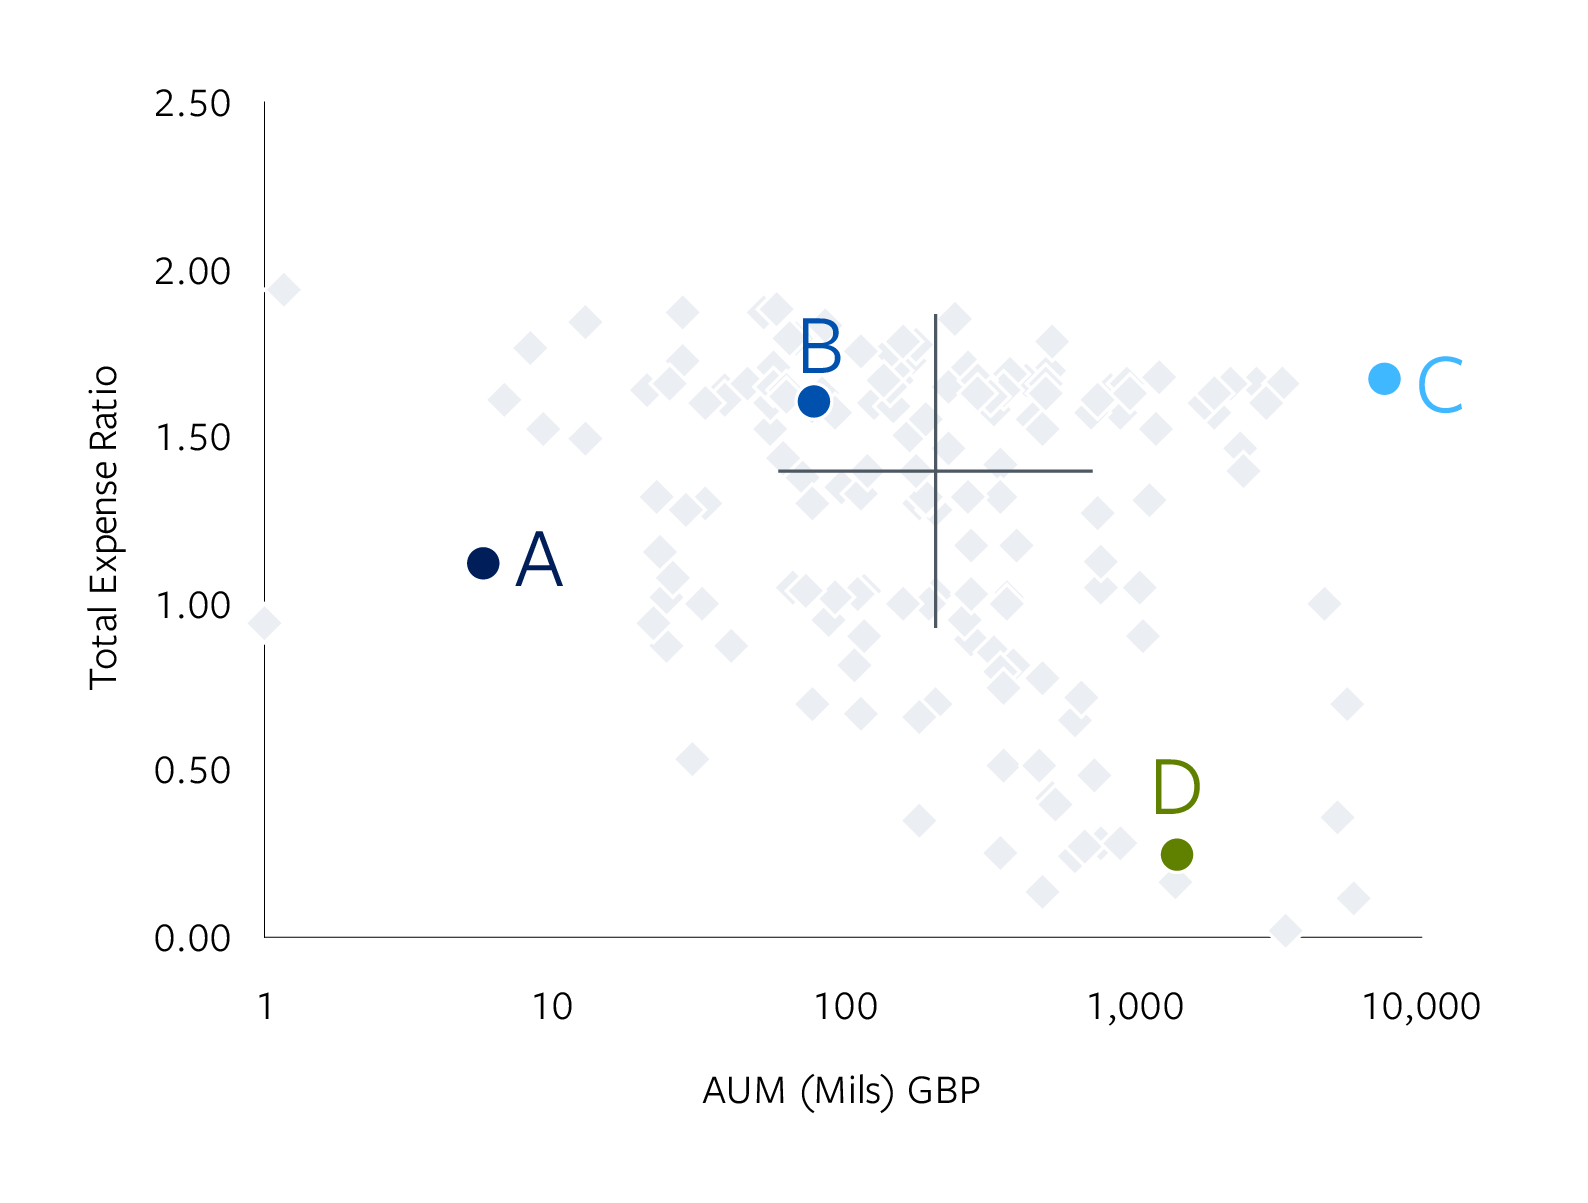
Fund A: A relatively small fund with just £8 million under management charged 1.20%—well below the median of 1.40% — and appears to be providing good value for shareholders based on relative expenses alone. As a director, one may wish to inquire further with management about this placement: was it the product of reimbursements by management? Do they expect this charge to persist in the years ahead? Let’s also consider performance: this fund happens to be a “smart beta” fund that intends to track a custom, non-standard index. But tracking this index has been less than optimal for investors, who have had only one year in the past seven since the fund’s inception where it ranked in the top half of its IA category. In addition, the fund has displayed below-average risk, with a beta of 0.92 relative to the FTSE All-Share.
Fund B: Although this £100 million fund is still half the size of the median, expenses are slightly higher than the median at 1.60%. Slightly higher expenses may be warranted depending on the complexity of the fund’s strategy. In this case, the fund’s mandate to seek high dividend-paying U.K. stocks with the potential to include fixed income securities doesn’t appear terribly intricate. Performance has rebounded well in the past three years, producing returns that rank in the 35th percentile, but longer-term performance ranks have been relatively volatile while its absolute volatility (as measured by beta) is rather low — perhaps owing to its somewhat conservative strategy. Investors have lost interest in this fund and fund assets have dropped 70% in the past eight years.
Total Expense versus 3 Year Return
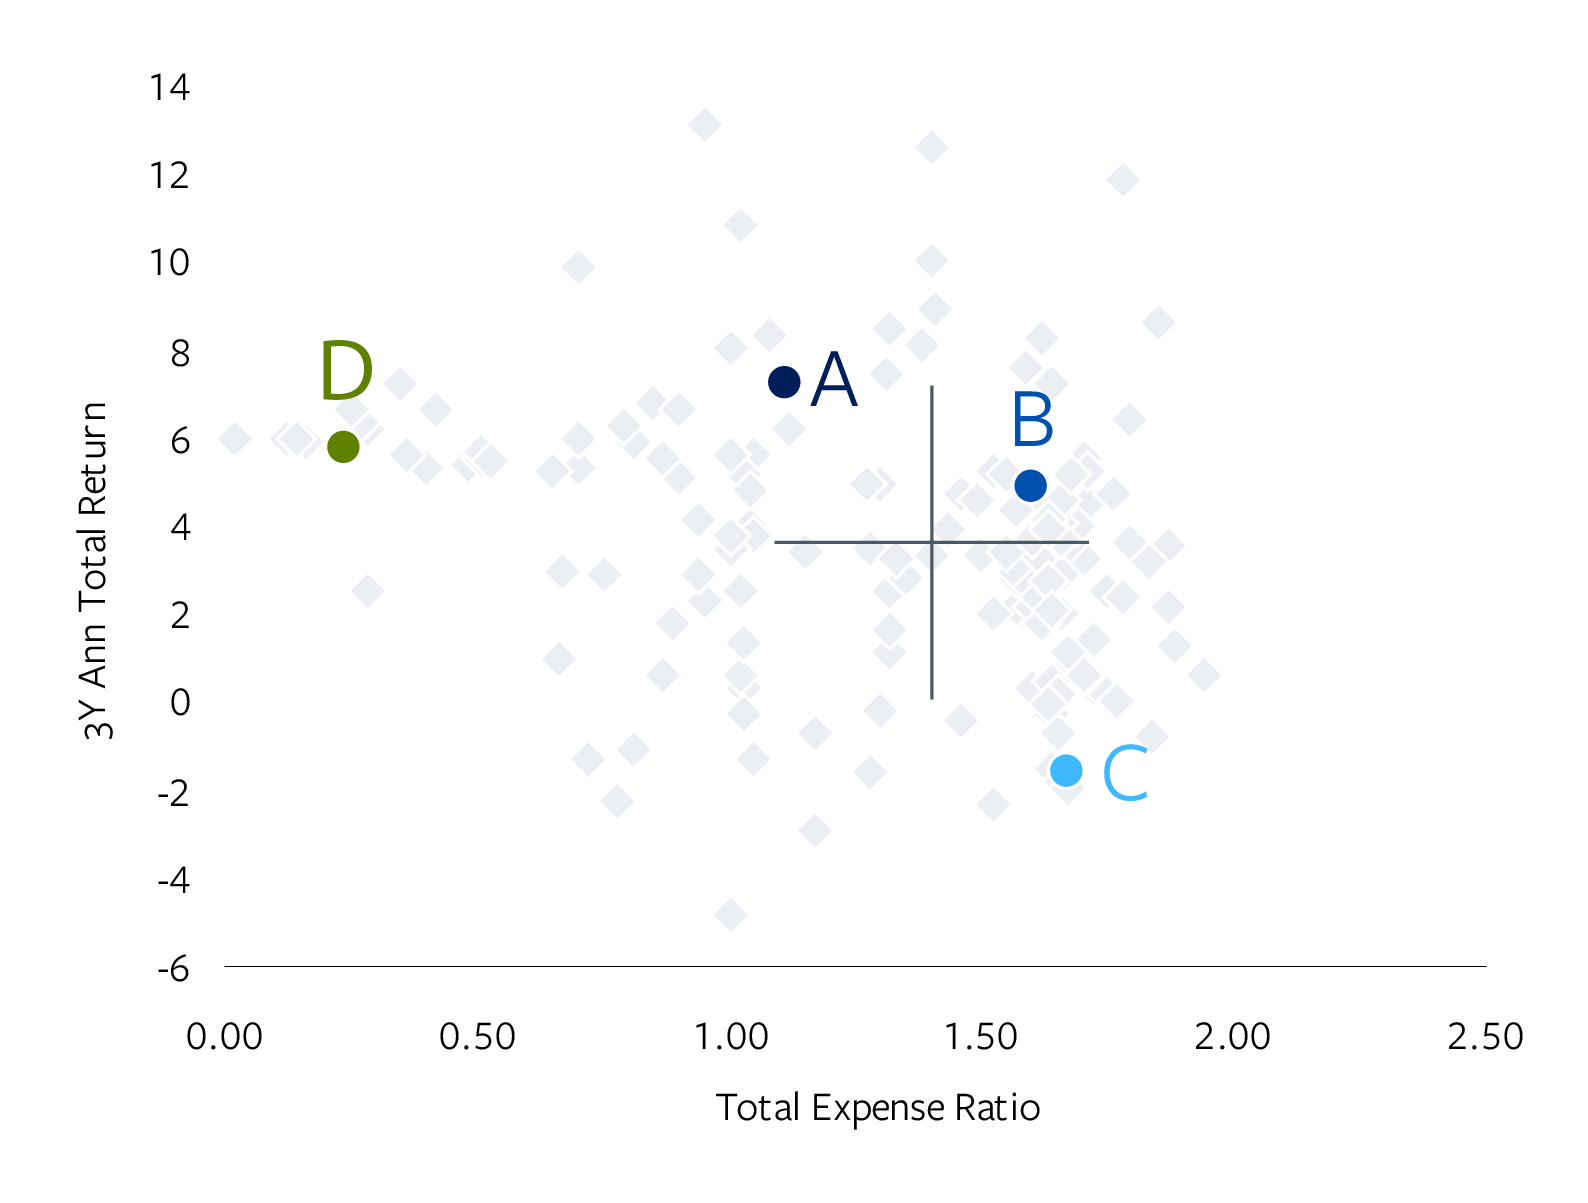
Fund C: Like Fund B, expenses are more than the median, but here we have a very large fund that is presumably more capable of passing economies of scale to investors. As with Fund B, this is also a U.K. equity fund that emphasizes income through dividends. But unlike Fund B, Fund C incorporates various derivative instruments and unlisted securities to enhance returns, which worked well for many years and proved attractive to many investors, but has stumbled badly in two of the past three years. The derivative overlay has mitigated both relative and absolute volatility (the fund’s beta is just 0.81), which may be considered an additional service for investors often not provided by similar fund managers. Directors may want to question management as to whether there is any diseconomy given its substantial assets, and to what extent unit holders benefit from the additional portfolio management techniques in light of higher expenses.
3 Year Standard Deviation versus 3 Year Performance
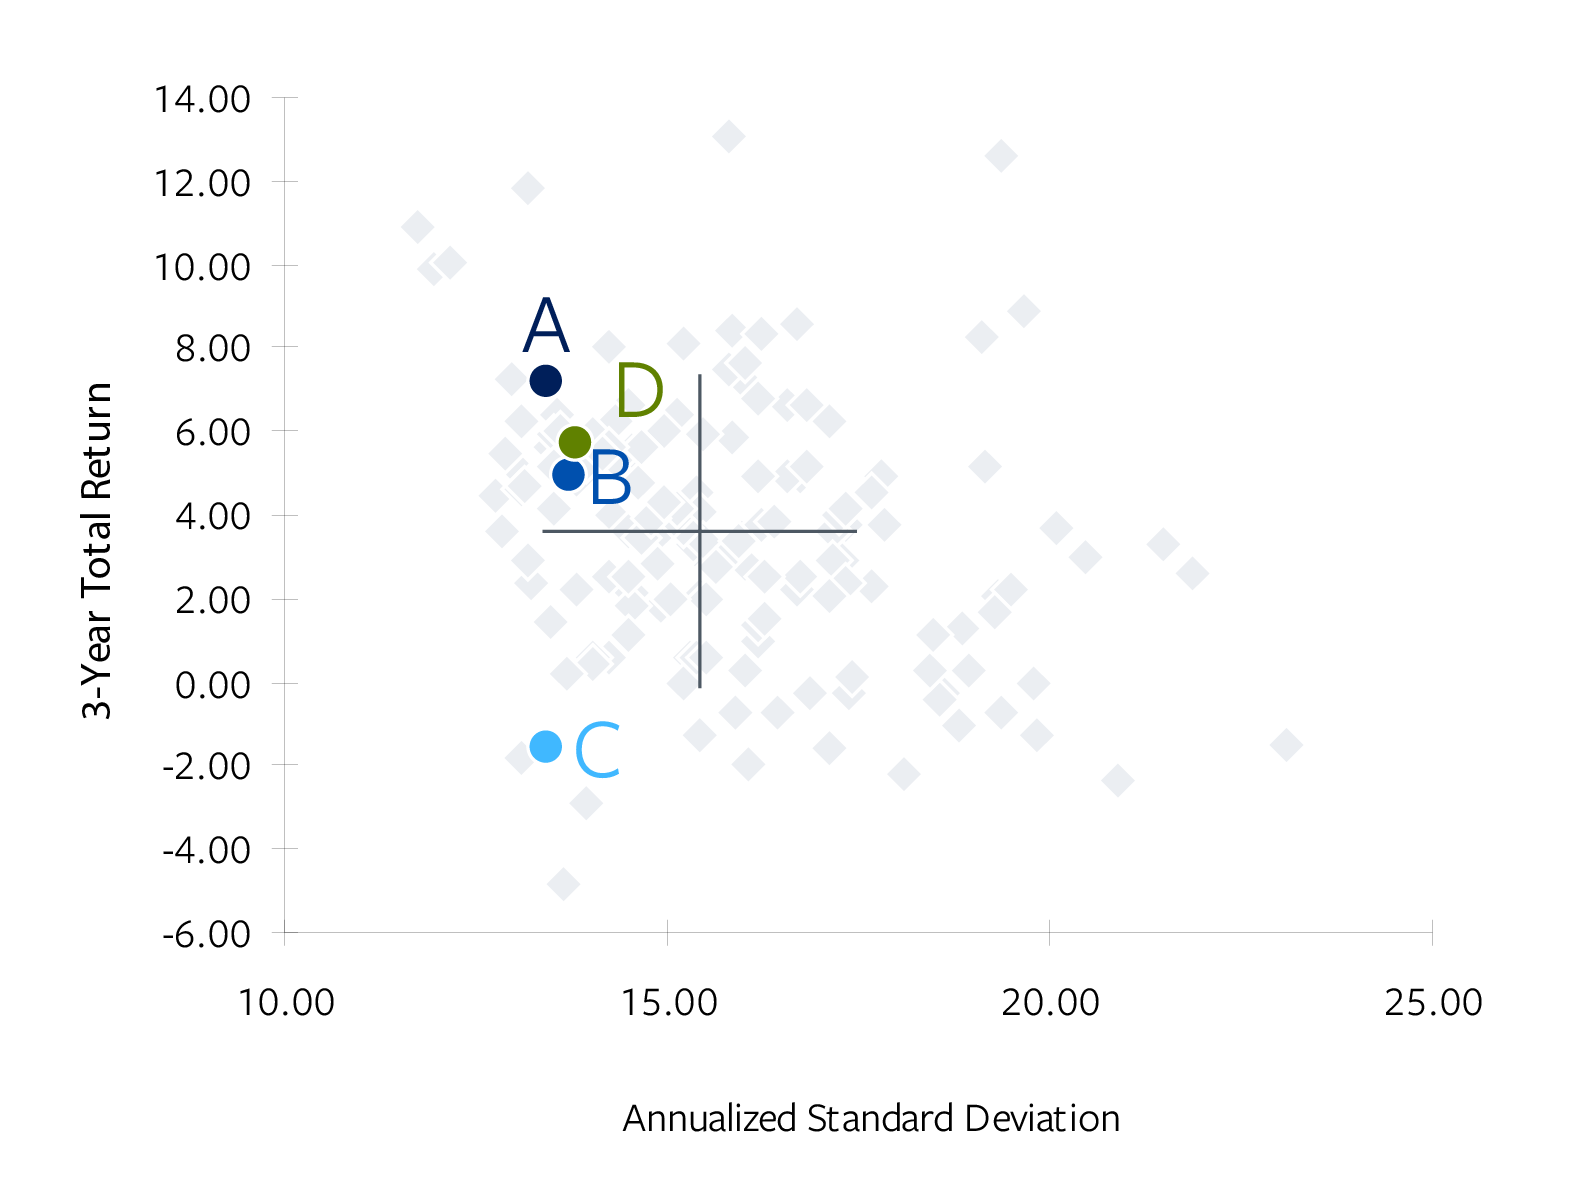
Fund D: At first glance this appears to be an easy one — and maybe it is. This fund is one of the larger products in the group and annual expenses are among the lowest, which suggests economies of scale have been passed to unit holders and value has been clearly demonstrated. Still, it’s worth consideration The fund is an index tracker, where low expenses are a must, and directors ought to consider where the fund ranks among similar index trackers — not just among active managers. The fund attempts to mimic the returns of the FTSE All-Share Index and has improved its execution in recent years, going from underperforming the index by 2.0% in 2014 to an underperformance of just 0.2% in 2018. As passive investing gains popularity in the U.K., is management ready to consider how this fund will be able to compete on price among commoditized peers?
Putting it All Together
Using a fund’s relative ranking is a reasonable starting point for the process of assessing value, as the case studies on previous pages demonstrate, it is by no means the only factor to consider. Comparisons and rankings can be deceptive when looking at a broad investment classification. Refining comparison groups to ensure they consist of funds with the most similar investment strategies can help ensure that qualitative data is meaningful. It’s incumbent on directors to know that a fund is “smart beta,” and should therefore have lower relative expenses than the larger classification.
Preparing for the Unknown
One part of the AoV work that management companies and i-Neds will need to undertake is the actual review of data and comparison groups to help determine if there is value for investors. Additionally, with the incorporation of Consumer Duty, boards will need to understand the impact of their review on other entities involved in the distribution process to retail investors. As we have just completed our first full cycle of Consumer Duty review, now is the time to look at processes to ensure that all aspects the Price and Value outcome have been reviewed and to ensure that feedback from other stakeholders are considered and integrated into the overall process.
Consumer Duty adds additional complexity to the value review process as three other outcomes need to be considered. One cannot look at price and value in isolation as part of the review process, rather consideration across all four outcomes will be critical to the review process. As a starting point during a review of the first year, the following steps should be undertaken:
- Engage with both the board and executive directors on content provided to make sure all key elements of AoV and Consumer Duty have been reviewed as part of the process.
- Outline the process’ project timeline to allow time to review all four outcomes at once.
- Review feedback from other stakeholders in the distribution chain to integrate new content to support their review as needed.
References
1 Asset Management Market Study remedies and changes to the handbook -Feedback and final rules to CP17/18 This relates to. (2018). https://www.fca.org.uk/publication/policy/ps18-08.pdf


Let’s talk about what’s next for you
Our representatives and specialists are ready with the solutions you need to advance your business.
Want to speak with a sales representative?
| Table Heading | |
|---|---|
| +1 800 353 0103 | North America |
| +442075513000 | EMEA |
| +65 6438 1144 | APAC |
Thank you.
Your sales rep submission has been received. One of our sales representatives will contact you soon.
Want to speak with a sales representative?
| Table Heading | |
|---|---|
| +1 800 353 0103 | North America |
| +442075513000 | EMEA |
| +65 6438 1144 | APAC |