閉じる
NEW YORK – April 14, 2021 – A much broader range of Americans are investing and engaging in U.S. financial markets, with Millennials, as well as households with the smallest amount to invest, growing in influence from year-end 2017 through June 30, 2020, according to a new quantitative study released by Broadridge Financial Solutions, Inc. (NYSE: BR), a global Fintech leader.
This study, the first-of-its kind and scale – Broadridge Insights on U.S. Investors – provides unprecedented evidence-based data and observations of investors who buy mutual funds, ETFs and equities through financial intermediaries. The study covered tens of millions of U.S. investor households and billions of data points, providing a unique perspective across generations, geography, educational attainment, channels, investment products, and wealth tiers.
“We are all witnessing an unprecedented and accelerated democratization of U.S. investing,” said Bob Schifellite, Broadridge’s Investor Communication Solutions President. “The signs are undeniable as younger investors, particularly Millennials, grew as a percentage of investors studied from 9% to 14% during this period. Additionally, households with the smallest amount to invest, referred to as the Mass Market, grew in influence from 30% to 38% of investing households. Many are investing using cost-effective ETFs, and more have broader access to low-cost institutional shares, highlighting a changing investing landscape.”
Millennials are up-and-comers in the market
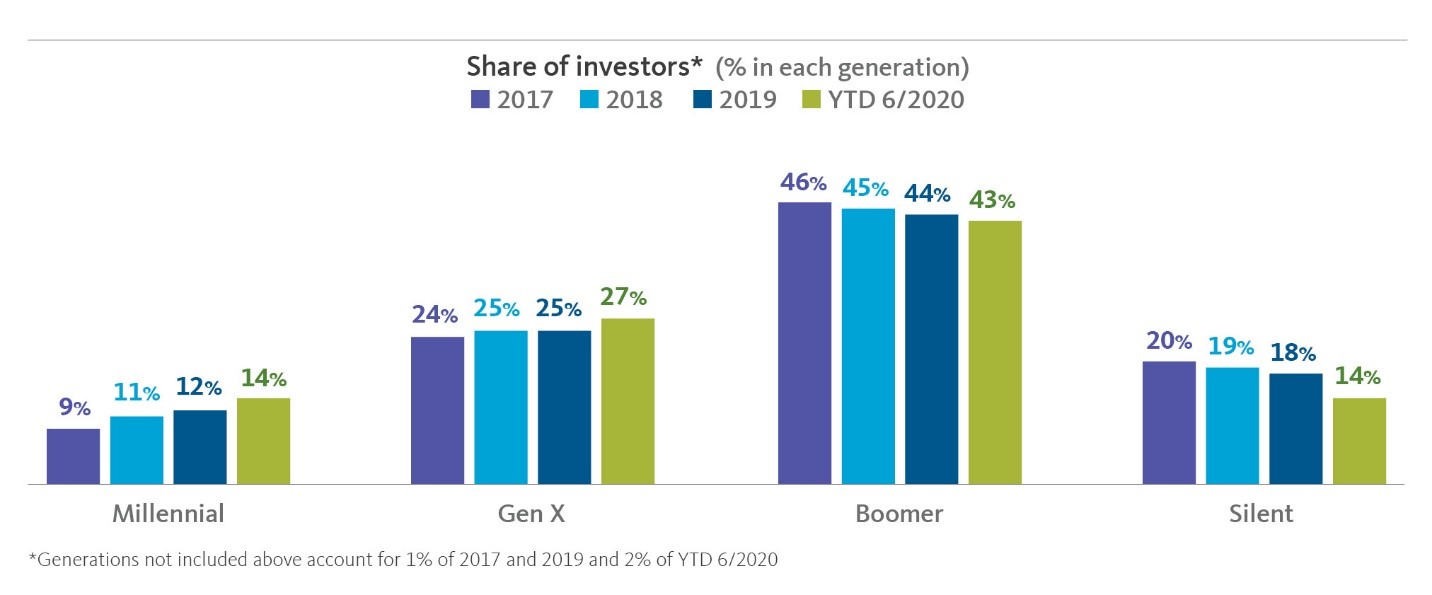
Millennials (born 1981 – 1996), the fastest-growing generation in numbers of investors studied, will continue to grow within the Mass Market segment and beyond. Millennials grew as a percentage of overall U.S. investors studied from 9% to 14% over the period and Gen X (born 1965 – 1980) grew from 24% to 27%.
Boomers (born 1946 – 1964) decreased as a total percentage of investors studied from 46% to 43% and the Silent Generation (born 1928 – 1945) also declined as a percentage of investors from 20% to 14% – but both still comprise 57% of the number of investors analyzed across the generational segments studied.
Mass Market rise
The Mass Market, defined as households with less than $100,000 in investable assets, grew in influence with a rising share of households and Assets Under Management (AUM). During the study period, the Mass Market grew from 30% to 38% of households with Mass Affluent ($100K to ≺$1MM) dropping from 57% to 51% and High Net Worth ($1MM+) dipping from 13% to 11%.
The Mass Market also represents a growing share of asset ownership, defined as investments in mutual funds, ETFs and U.S. equities. Despite lower household AUM of 10% of the overall assets studied, the Mass Market gained 3% in asset ownership share since 2017. In contrast, Mass Affluent and High Net Worth AUM decreased over the same period.
“The study highlights trends that are indicative of things to come and present enormous opportunity for asset managers and advisors who adapt to address the emerging needs of investors,” said Dan Cwenar, Broadridge’s President of Data and Analytics. “Money is expected to continue to flow into low-cost investment vehicles such as passive and active ETFs and Millennials and Mass Market investors will continue to gain influence as their assets grow.”
Investors purchased low-cost Institutional Shares and ETFs
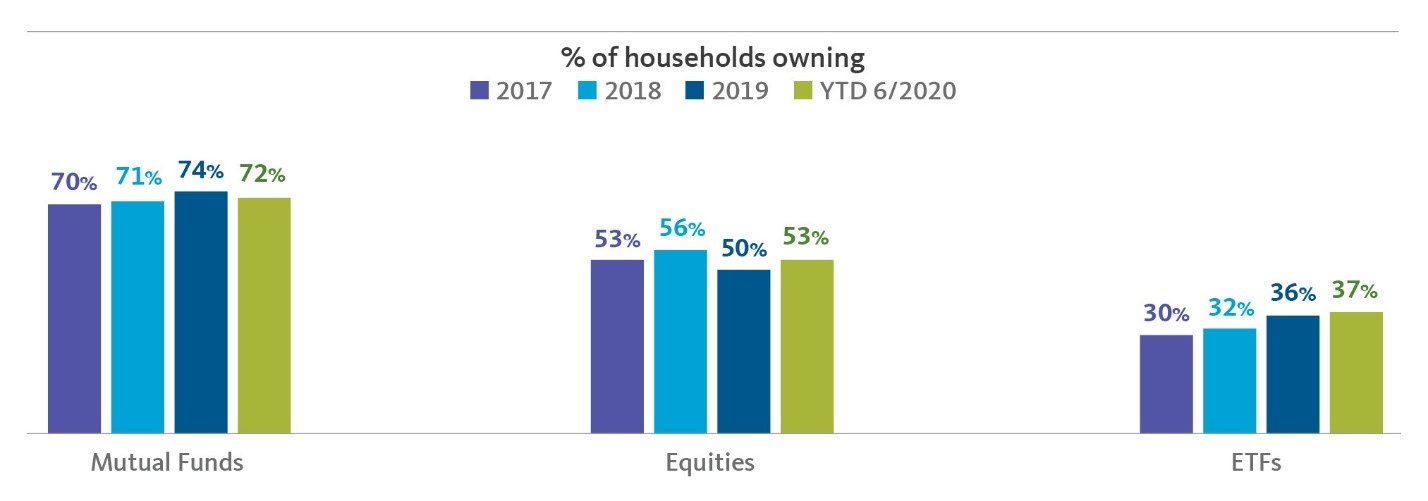
While A-class shares and institutional shares are the most widely held by households, A-class shares declined in household ownership from 43% at the end of 2017 to 39% on June 30, 2020. During the same period, household ownership of institutional shares grew from 44% to 54%.
Household ownership of ETFs grew steadily from 30% to 37%. In contrast, the share of mutual funds increased 2% over this period, although U.S. equities growth was flat.
Limited Pandemic Asset Shifts Effects Seen Across Generations, but Equities Rise
Boomer and Silent generations were at or above their pre-Covid AUM levels by the end of June 2020.
Boomer and Silent generations comprised 76% of household AUM and fared slightly better than Gen X and Millennials who were slightly below pre-Covid AUM levels.
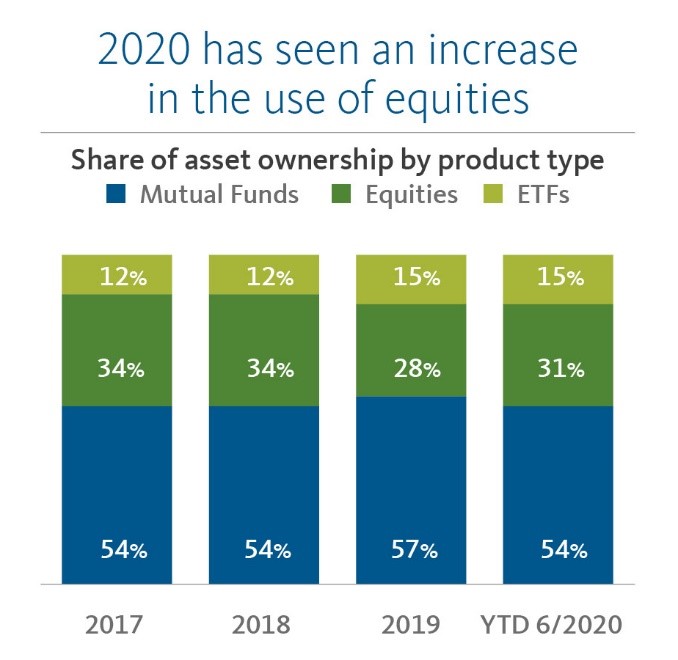
However, purchases of U.S. equities increased to 31% as of June 30, 2020, a 3% uptick over 2019. Increases were experienced (in order) by Millennials, Gen-X and Boomers.
Regional Differences
The highest concentration of Mass Market households was in the South (38%) while the highest concentration of High Net Worth (HNW) households was in the West (41%) – California alone accounted for 28% of HNW households.
Mass Affluent households were more evenly divided across regions, with the highest concentration in the South (32%).
The South consistently had the highest concentration of households across all distribution channels ranging from 31% for RIA, 31% for Online, 33% for Broker-Dealer and 35% for Wirehouse. However, the least concentration varied with Broker-Dealer and RIA both at 19% in the Northeast and Wirehouse (18%) and Online (19%) in the Midwest.
Study Methodology
Drawing on anonymized data, this study delivers a unique, evidence-based view of investor holdings.
This study focused on individual investor holdings through intermediaries. The sample does not include:
About Broadridge
Broadridge Financial Solutions (NYSE: BR) is a global technology leader with the trusted expertise and transformative technology to help clients and the financial services industry operate, innovate, and grow. We power investing, governance, and communications for our clients – driving operational resiliency, elevating business performance, and transforming investor experiences.
Our technology and operations platforms process and generate over 7 billion communications per year and underpin the daily trading of more than $10 trillion of securities globally. A certified Great Place to Work®, Broadridge is part of the S&P 500® Index, employing over 14,000 associates in 21 countries.
For more information about us, please visit www.broadridge.com.
報道関係者 お問い合わせ先 :03-5425-7220, アシュトン・コンサルティング BroadridgeJapanPR@ashton.jp。